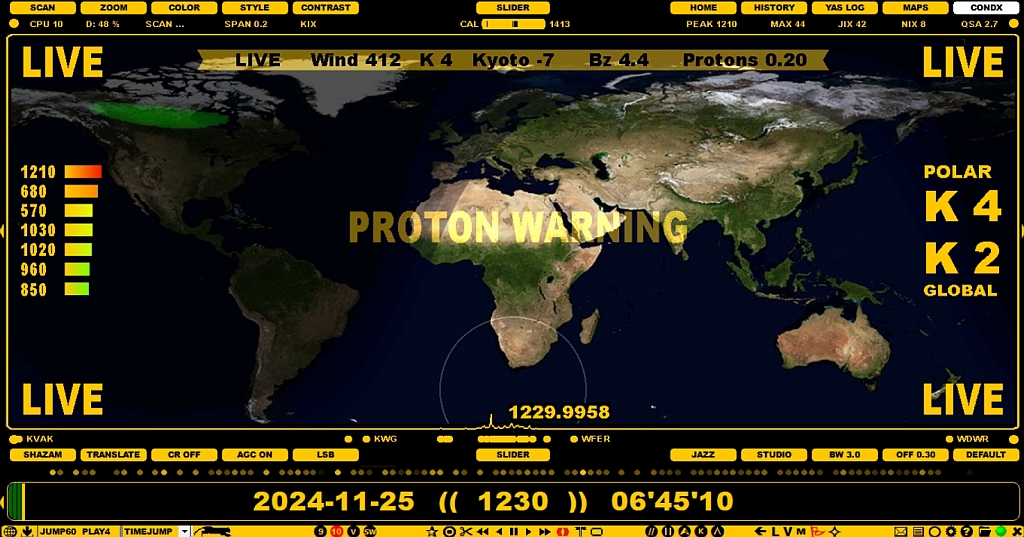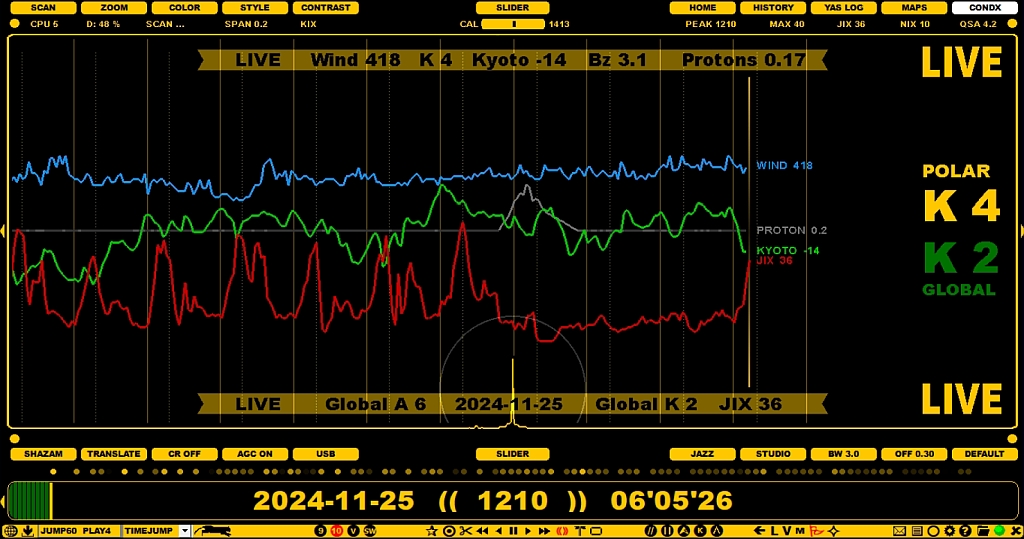
JAGUAR is more than well connected to the current and historical online space weather data ("SPACE WX"). The main space weather display is CONDX, which is the fifth JAGUAR main display. This CONDX display has two modes: LIVE MAP and history GRAPHS.


In addition, the solar data can be found in:
Just click SLIDER > CONDX, and you can toggle between LIVE MAP and GRAPHS (history).
LIVE MAP shows the real time space weather situation (the most important space wx data) and the world map with the current aurora oval. If you have activated the Perseus connection, you will also see seven strongest frequencies for the selected stepping - you can click and jump to any of those listed frequencies.
LIVE MAP shows also the POLAR K (Tromso) and the GLOBAL K values, which are most often used cx indicators for the upcoming rx conditions.
Some solar data values can indicate immediate major changes in the MW reception, and especially the proton and Bz values should be monitored closely. High proton values often mean poor to very poor rx conditions over the pole and low negative Bz values indicate possible improved rx from the southern areas of the globe. If the Proton / Bz thresholds are exceeded, you'll see PROTON ALERT (or WARNING) or SOUTH ALERT (or WARNING) on the LIVE MAP display.
GRAPHS shows the index developments around the playback day. You can also move the mouse over the graphics area and scroll the days backwards/forwards with the mouse wheel (dragging the area left/right is also possible). The maximum time range that can be shown is four weeks.
On the GRAPHS display you will see how the Kyoto DST (light green), Solar wind (blue) and Proton flux (gray) indices have developed over the days. Also, if you are using a PC which recorded the playback files, you will see the JIX (J-index) CURVE (red). The JIX CURVE shown here depends on the current frequency-stepping you have enabled (MW10 or MW9). See the JIX help for details.
One rule of thumb which can be deduced from these indices is this: whenever the Kyoto DST index plummets (goes to negative values, especially below -10), the global & polar A indices rocket, and, as a consequence, the conditions (trans-oceanic conditions in particular over the poles) will deteriorate.
To close the CONDX screen, select some other display from SLIDER.
In addition to the dedicated CONDX screen, an extended space weather report is readily available in the TOOLBAR > WWW (select SPACE WX from the JAGUAR home page). This space weather data is read in real-time from the Internet.
The explanations of the parameters shown in the space weather tables under the SPACE WX menu are as follows:
SSN: Last measured daily sunspot number
SSNm: Last predicted monthly smoothed sunspot number
SFI: Last measured solar flux index
90-day SFI: 90-day mean solar flux index
Au (N): Aurora index (north).
Kt: Last measured Tromso (Norway) K index.
At: Last calculated Tromso (Norway) A index. The same as Polar A index in the space weather screen.
Kyoto Dst: The Kyoto Dst index.
Bz: The direction of the IMF or interplanetary (the Sun's) magnetic field.
SW: Solar wind speed (in km/s, typically around 400 km/s)
X-Ray: Last measured X-Ray value.
PCA: 24-hour Polar Cap Absorption forecast (typically caused by proton events, therefore other proton measurements not mentioned).
Proton: Current proton flux.
Kp: Last measured planetary K index.
Ap: Last calculated planetary A index. The same as Global A in the space weather screen.
Dst: Another Dst index
24-h Kt: The last eight K index values from Tromso (Norway)
These parameters are followed by yesterday's and today's X-Ray events, exceeding the C level. On the right table, a 3-day outlook (OUTLOOK) on the space weather is shown, in terms of the Solar Flux Index (SFI), Planetary A index (Ap) as well as the maximum values for K index (Kp) on the high latitudes (HL) and mid-latitudes (ML).
The rest of the table shows the forecasts for High Latitude Geomagnetic and Mid Latitude Geomagnetic Disturbances for up to the next 48 hours.
The SPACE WX data in these refer to a subset of the aforementioned values monitored and saved during the time of the playback. The file header data can be displayed by pressing ALT-H and the Space Weather banner can be seen by clicking TOOLBAR > SPACE WEATHER.